The cost of my current
This will shock no one given my lifestyle data obsession and current work focus, but I am now monitoring our home energy usage (and cost) in real time.
Back in April I noted in a harmless tweet what seemed to be far more attention to home power monitoring solutions in the UK than in the US. This prompted my excellent colleagues at IBM Hursley to try to help me out. The geeks at Hursley had for a while been playing around with the data outputs of monitoring hardware made by Current Cost. They saw my tweet, knew that Current Cost had modified some of their gizmos for US usage, and arranged to send me one.
I have bad luck with electrical home projects and I feared this one quite a lot given that I’d have to fuss with the house mains, but the installation proved remarkably easy. True, there are (as yet) no US-specific FAQs or video tutorials, but the idea was straightforward: find the mains and put the clamps over them.
In most of the UK this means locating the circuit breaker/meter combo which is located outside the house. In the US, only the meter is outside the home (due to the outdated practice of having electrical company employees drop by to read it). Yet, that’s where I started. And almost ended. The meter is sheathed in metal for obvious reasons and there didn’t seem to be any easy way in without a blowtorch. Live wires I figured I could handle; molten metal and live wires, no.
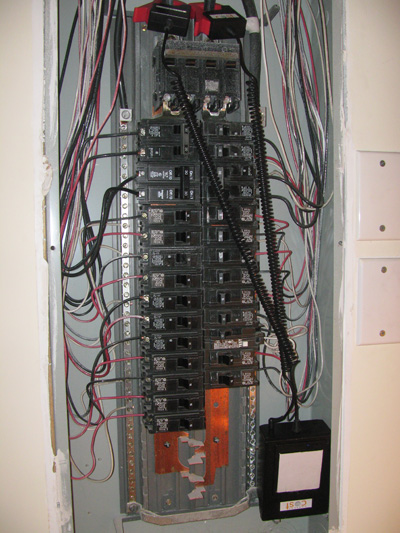
So back inside to dismantle the circuit breaker. And there they were. Three big cables: two mains, plus a ground (at the very top of the photo).
You don’t mess with wiring at all, actually. Just gently place the clamps right on the insulated lines. The clamps lead to a battery-powered transmitter box. I bolted the breaker back up and that was that. Once I plugged in the receiver I was immediately receiving real-time data and cost for electricity usage.
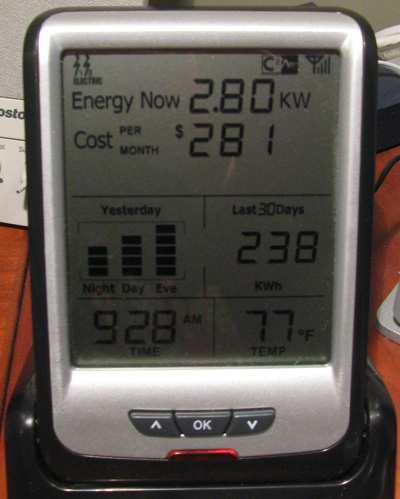
In the image above you see that the display shows two power feeds (one per main) in the upper left and that it has a firm connection to the transmitter (upper right). You always have a current energy usage readout (2.8KW). The cost cycles between at-the-moment and per month. The display is rounded out with historical data, time, and temp. (Here’s an annotated version.)
At a glance the data seems dead-on compared to our monthly electricity bills. And it is true that the current usage/cost changes merely by switching lights off and on around the house. It is definitely real-time. But the real value of the system comes in the ability to hook the monitor to your computer. Once that link is established there’s a whole set of services you can plug into.
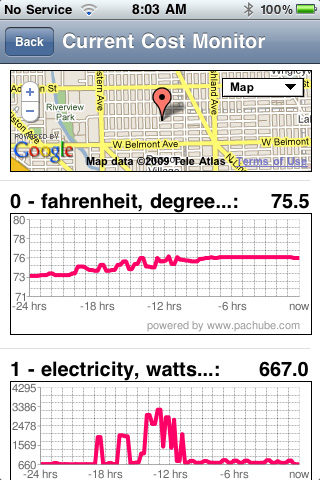
I use the Current Cost to Pachube app to send my data to the feed aggregator/visualizer service Pachube. Once there you can view the three data feeds — temperature and wattage for the two mains — over time. (The y axis is power in kilowatts.)
The week after I installed the unit we took a bit of a vacation so we were afforded the experiment of observing the house while we were not living in it. Obviously usage was way down (especially since we essentially shut off the AC), but the very quietness of the electricity usage surfaced interesting patterns in home energy consumption unprompted by human need. The graphs were mostly flatlines with regular, periodic low plateaus — obviously something was kicking in on a regular interval. We’re pretty sure one of these is the refrigerator/ice-maker, but there’s one on the other main that we’ve not been able to sleuth just yet. Has to be something with a motor, we think.
We asked our housekeeper to come while we were out — and of course knew precisely when she was there because the graph spiked (vacuum cleaner!). But the next day the graph spiked at roughly the same time and in the same way. Turns out she left early the first day and came back to finish the second (since we weren’t there). So there it is: personal energy monitoring can also help you nab squatters and spy on your home help.
Because Pachube is really a service for mixing various sets of data (ala ManyEyes) you can nearly instantly see your home’s energy usage plotted as CO2 output. And there’s a great iPhone app for viewing your Pachube feeds.

So there are two reasons to care about any of this and both relate to increasing awareness of one’s own consumption patterns (something I wrote about extensively after my stint in Africa). First is cost savings. When you have in-your-face evidence of the impact of turning down the AC or switching off the lights, you are more inclined to do it. (To say nothing of using the monitor to track down energy sucks you didn’t know you had.)
Second is that the idea of instrumenting part of one’s consumption opens up all kinds of possibilities for how we might as a planet solve larger problems. Few would argue that we need smarter power grids. Bills that reflected actual usage (rather than estimated or aggregate) would prompt even great attention to personal usage. Widespread adoption of home monitoring like Current Cost — and the sharing of anonymous data — would show utilities and local governments patterns of usage that could inform smarter maintenance, more flexible infrastructure build-out, and even “competitive” incentive programs between localities.
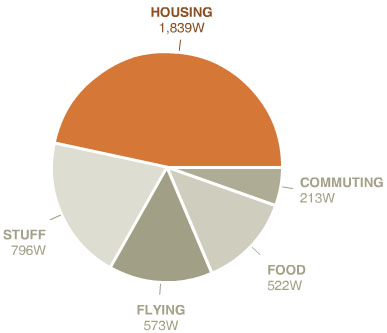
Last year I used WattzOn to calculate a rough personal footprint. It was atrocious. Sure I commute to work by public transportation or bike, but my international air travel shoved my impact off the charts. This year my travel is very different — lots of small trips, none international. So I recalculated my CO2 and, no surprise, housing is the number one contributor. (And that’s just the house and the power/materials it uses. The Stuff category in the chart below largely deals with our home’s appliances.)

My goal is modest. I’ve like to bring the combined housing and stuff number down by 25% in twelve months. Not sure if that’s possible with the three kids, but they do like the idea of real-time feedback for their actions (rather than, say, a parent praising them merely for turning off the lights in their rooms).
In the end, beyond the sheer nerd factor of monitoring your own energy, what good is it if you don’t use the new information to effect change?


Another example of feedback influencing behaviour, this time with regard to water usage: http://infosthetics.com/archives/2009/09/show-me_water_consumption_in_the_shower_at_a_glance.html
I wonder if anyone’s looked at making some kind of power cable that reacts to how much power is going through it, maybe by glowing brighter? If it could be done without using more energy than it actually saved.