Shovel Ready
Heading into winter late last year we were told that it was going to be one for the record books. And so it has been. Temperatures have yet to go into minus territory and there are towns in Texas with more snowfall than we’ve had. It’s downright bizarre.
But I’m a believer in meteorological karma. Sure, we’re trending way behind average snowfall to date. But that doesn’t mean Old Man Winter can’t go for a late game Hail Mary. I’ll put away the shovel in June.
That’s basically the philosophy of preparedness behind a slew of winter-focused applications created by the City of Chicago over the last weeks at chicagoshovels.org.
It’s all about scales of sharing, really. Last year’s blizzard showed a side of our city rarely talked about: authentic neighborliness. Chicagoans came to each others’ aid, made friends on stranded public transit, and generally bonded in the face of potential calamity. The idea behind Chicago Shovels is to facilitate this latent drive to be good neighbors, to offer tools for sharing in the common experience of a heavy snowfall.
The sharing extends to the code itself. Civic-minded volunteers came together to build parts of Chicago Shovels and some of the code itself was shared via a Code for America-developed project in Boston. And, of course, we’re sharing what we’ve built on our Github account. Cross-municipality, open source development is the way forward.
Many different threads of Mayor Emanuel’s technology mandate are bound together in Chicago Shovels.
Plow Tracker, the first app to launch and certainly the most popular, is a good case study in open data for transparency and accountability. While I talk a lot about open data as a driver of economic development and as analytics fodder, the lesson from Plow Tracker’s launch — and the record-shattering traffic it drove to the city’s website — is that we shouldn’t forget that the ability to peer into the workings of government is the first and possibly most important function of open data.
The Tracker is a good illustration of our open data initiatives: more information is always better than less. If there are patterns to be found, they will be. And no matter what they are, such analysis leads to a more efficient city government.
Plow Tracker is only on during storms, of course. It shows where plows are in real-time with a bit of information as to the city “asset” you are looking at. This is normally salt-spreading plows, but in bigger snow events can include garbage trucks with “quick-hitch” plows attached and even other city vehicles outfitted to plow. As Chicagoist pointed out, watching the map can remind you of a certain popular video game from the 1980’s.
Feedback from the public, coverage in the press, and inquiries from other cities has been overwhelmingly positive. Many have asked for increased functionality, such as a visualization of what streets are cleared. This is tough, as we do not have real-time data on the status of city streets, except what can be visually inspected via cameras and the plow drivers themselves.
Undaunted, the team at Open City took the Plow Tracker data and created Clear Streets. Where Plow Tracker shows where the plows are, Clear Streets shows you where they have been. (If we’re keeping with the gaming analogies, this is to Etch-a-Sketch what the Tracker is to Pac-Man.)
Clear Streets is obviously useful and a great example of the ecosystem of civic developers that are growing on the periphery of government thanks to open data. And with Chicago’s digital startups reaching critical mass and real attention from venture firms, the city is doing its part in nurturing “civic startups” like Open City. (Here’s a clip of the Open City crew and me discussing all this on WTTW’s Chicago Tonight.)
A last note on (and lesson from) the Tracker: context is key. The little text blurb above the map is really crucial to understanding what you are looking at. As an example, sometimes plows are deployed before it starts snowing for preemptive salting of bridge decks. If you did not have this information it would be difficult to rationalize the placement of plows. It’s a lesson for open data in general. The more data, especially real-time data, the more context matters.
Adopt-a-Sidewalk
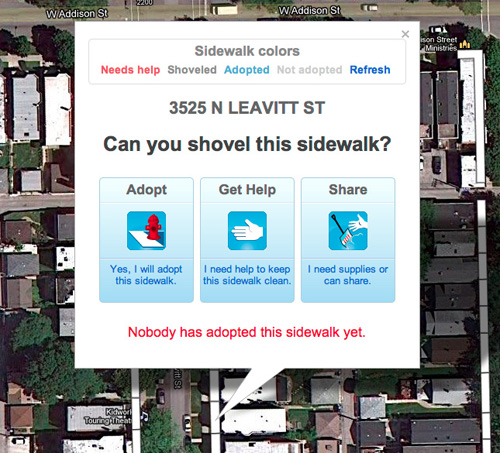
The site’s most recently launched app, Adopt-a-Sidewalk, represents the original idea for Chicago Shovels.
Last fall, as Chicago was preparing to become a 2012 Code for America city, we learned about a side project from the Code fellows in Boston. Early in 2011 they had arrived to work on a project with Boston schools but were met with a blizzard. So they built Adopt-a-Hydrant. This idea was to encourage residents to “claim” fire hydrants for shoveling out during the winter. Simple, smart, the right thing to do. And the code was open source.
So we took it with the idea of creating something similar but focused on the public way. We thought we could go a bit bigger than hydrants. See, the Chicago Municipal Code requires residents and businesses to shovel the sidewalk in front of their property. So why not allow them to claim it or claim someone else’s — or ask for help? Claim a parcel, mark it as cleared, track your achievements.
Alas, winter in Chicago has long been associated with “claiming” parts of the public way. Adopt-a-Sidewalk attempts to capitalize on this impulse for the good of pedestrians, minus the lawn furniture and household detritus. (And we’re not the only ones trying to expand the definition of wintertime dibs to the sidewalk itself.)
Again, this has been one weird winter. Snow is scarce and temps are routinely above 40. If it ever does snow again, though, Adopt-a-Sidewalk is ready to promote community responsibility and actual sharing. We partnered with local startup OhSoWe to integrate neighborhood-based sharing into Adopt-a-Sidewalk. Locate your sidewalk — or a parcel you’d like to help out on — and instantly see who around you is willing to lend shovels, salt, even a snow blower.
It’s been noted that the City creating its own apps is a bit of a departure from our data-centric approach to date. (Noted, I might add, in the most strenuous way, with real constructive criticism from engaged residents.)
The truth is that having Mother Nature on the critical path to deployment is a tough, stressful thing. (She’s neither agile nor a fan of the Gannt.) We knew snow was coming and we knew we needed Plow Tracker up for the first major storm. Launching an app was something that could not slip. Adopt-a-Sidewalk, while built with volunteer assistance, was partially an effort at proving that municipal code sharing is real and viable. Both of these builds demonstrate that the City will create apps when there are reasons to do so. But that in no way detracts from our belief that the community and the marketplace are the sources of real innovation that come from Chicago’s open data.
And we have that too. Chicago Shovels’ last major app category showcases community-built applications. The two most useful are actually wintertime reworkings of earlier incarnations.
Last year civic über-developer Scott Robbin built SweepAround.us, an app for alerting residents the night before the City would be sweeping streets in their area so they could move their cars from the street (avoiding a ticket). This was the perfect app for tweaking to accommodate a system for alerts about the City’s 2″ Snow Parking Ban. SweepAround.us became 2inch.es.
Similarly, Robbin’s wildly popular wasmycartowed.com was updated to include automobile relocations due to snow emergencies.
A slew of winter-related resources round out the site, including a number of winter-related apps from last year’s Apps for Metro Chicago competition, information on how to become part of the City’s official volunteer “Snow Corps”, one-click 311 request submission, FAQ’s, and subscription to Notify Chicago alerts.
Chicago Shovels is the city’s best example to date of the value of open data. Transparency and accountability (Plow Tracker), reuse and sharing (Adopt-a-Sidewalk), business creation (Clear Streets), efficiency and ease-of-use (2inch.es and wasmycartowed.com) — these are the outcomes of a policy of exposing the vital signs of the city.
Now if it would only snow — and stick.
Open data in Chicago: progress and direction
In a wonderfully comprehensive overview of Government 2.0 in 2011 up at the O’Reilly Radar blog Alex Howard highlights “going local” as one of the defining trends of the year.
All around the country, pockets of innovation and creativity could be found, as “doing more with less” became a familiar mantra in many councils and state houses.
That’s certainly been the case in the seven-and-a-half months since Mayor Emanuel took the helm in Chicago. Doing more with less has been directly tied to initiatives around data and the implications they have had for real change of government processes, business creation, and urban policy. I’d like to outline what’s been accomplished, where we’re headed and, importantly, why it matters.
The Emanuel transition report laid out a fairly broad charge for technology in his office.
Set high standards for open, participatory government to involve all Chicagoans.
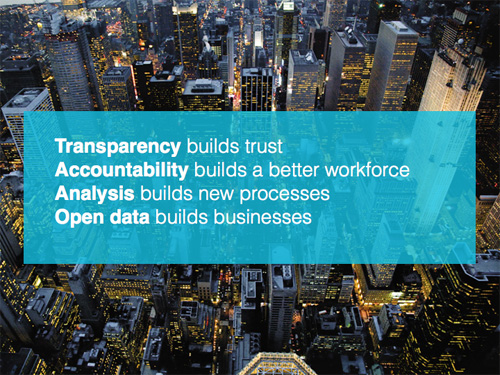
In asking ourselves why open and participatory mattered, we developed the following four principals. The first two, fairly well-established tenets of open government; the last two, long-term policy rationales for positioning open data as a driver of change.
First, the raw materials. Chicago’s data portal, which was established under the previous administration, finally got a workout. It currently hosts 271 data sets with over 20 million rows of data, many updated nightly. Since May 16 the portal has been viewed over 733,201 times and over 37 million rows of data have been accessed.
But it’s the quality rather than the quantity that’s worth noting. Here’s a sampling of the most accessed data sets.
- TIF Projection Reports
- Building Permits (2006 to present)
- Food Inspections
- Vacant and Abandoned Buildings Reported
- Crimes – 2001 to Present (more block-level crime data than any other city, updated nightly)
Here’s a map view of the installed bike rack data set.
As a start towards full-fledged performance management, we launched cityofchicago.org/performance for tracking most anything that touches a resident: hold time for 311 service requests, time to pavement cave-in repair, graffiti removal and business license acquisition, zoning turnarounds, and similar. Currently there are 43 measurements, updated weekly. Here’s an example for average time for pothole repair.
To be sure, all this data can be inscrutable to residents. (One critic of the effort called it “democracy by spreadsheet”.) But the data is merely a foundation, not meant as a end in itself. As we make the publication of this data part of departments’ standard operating procedure the goal has shifted to creation of tools, internally and in the community, for understanding the data.
As a way of fostering development of useful applications, the City joined its data with Chicago-specific sets from the State of Ilinois, Cook County, and the Chicago Metropolitan Agency for Planning to launch an app development competition. Anyone with an idea and coding chops who used at least one of the City’s sets was eligible for prize money put up by the MacArthur Foundation.
Run by the Metro Chicago Information Center, Apps for Metro Chicago was open for about six months and received over 70 apps covering everything from community engagement to sustainability. (You can find the winners for the various rounds here: Transportation, Community, Grand Challenge.)
Here are some of my favorite apps created from the City’s open data.
- Mi Parque – A bilingual participatory placemaking web and smartphone application that helps residents of Little Village ensure that their new park is maintained as a vibrant safe, open and healthy green space for the community.
- SweepAround.us – Enter your address, receive an email or text message letting you know when the street sweepers are coming to your block so you can move your car and avoid getting a ticket.
- Techno Finder – Consolidated directory of public technology resources in Chicago.
- iFindIt – App for social workers, case managers, providers and residents to provide quick information regarding access to food, shelter and medical care in their area.
The apps were fantastic, but the real output of A4MC was the community of urbanists and coders that came together to create them. In addition to participating in new form of civic engagement, these folks also form the basis of what could be several new “civic startups” (more on which below). At hackdays generously hosted by partners and social events organized around the competition, the community really crystalized — an invaluable asset for the city.
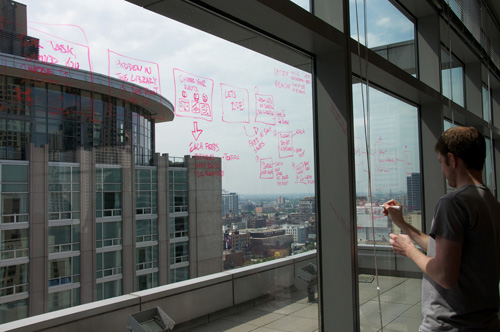
Open data hackday hosted by Google
Beyond fulfilling a promise from the transition report, why is any of this important? The overarching answer is not about technology at all, but about culture-change. Open data and its analysis are the basis of our permission to interject the following questions into policy debate: How can we quantify the subject-matter underlying a given decision? How can we parse the vital signs of our city to guide our policymaking?
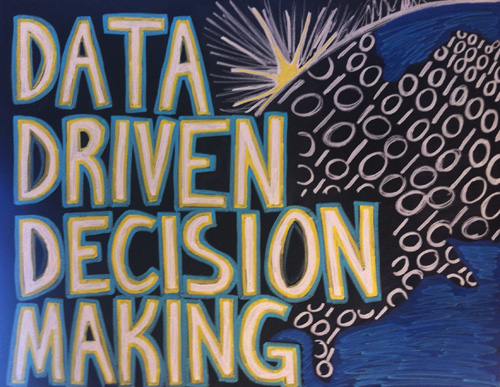
The mayor created a new position (unique in any city as far as I know) called Chief Data Officer who, in addition to stewarding the data portal and defining our analytics strategy, is instrumental in promoting data-driven decision-making either by testing processes in the lab or by offering guidance for problem-solving strategies. (Brett Goldstein is our CDO. He is remarkable.)
As we look to 2012, four evolutions of open data guide our efforts.
The City-as-Platform
There are a variety of ways to work with the data in the City’s portal, but the most flexible use comes from accessing it via the official API (application programming interface). Developers can hook into the portal and receive a continuously-updated stream of data without manually refreshing their applications each time changes happen in the feed. This changes the City from a static provider of data to a kind of platform for a application development. It’s a reconceptualization of government not as provider of end user experience (i.e., the app or service itself), but as the provider of the foundation for others to build upon. Think of an operating system’s relationship to the applications that third-party developers create for it.
Consider the CTA’s Bus Tracker and Train Tracker. The CTA doesn’t have a monopoly on providing the experience of learning about transit arrivals. While it does have web apps, it exposes its data via API so that others can build upon it. (See Buster and QuickTrain as examples.) This model is the hybrid of outsourcing and civic engagement and it leads to better experiences for residents. And what institution needs a better user experience all around than government?

But what if all City services were “platform-ized” like this? We’re starting 2012 with the help of Code for America, a fellowship program for web developers in cities. They will be tackling Open 311, a standard for wrapping legacy municipal customer service systems in a framework that turns it too into a platform for straightforward (and third-party) development. The team arrives early in 2012 and will be working all year to create the foundation for an ecosystem of apps that will allow everything from one-snap photo reporting of potholes to customized ward-specific service request dashboards. We can’t wait.
The larger implications of platformizing the City of Chicago are enormous, but the two that we consider most important are the Digital Public Way (which I wrote about recently) and how a platform-centric model of government drives economic development. Bringing us to …
The Rise of Civic Startups
It isn’t just app competitions and civic altruism that prompts developers to create applications from government data. 2011 was the year when it became clear that there’s a new kind of startup ecosystem taking root on the edges of government. Open data is increasingly seen as a foundation for new businesses built using open source technologies, agile development methods, and competitive pricing. High-profile failures of enterprise technology initiatives and the acute budget and resource constraints inside government only make this more appealing.
An example locally is the team behind chicagolobbyists.org. When the City published its lobbyist data this year Paul Baker, Ryan Briones, Derek Eder, Chad Pry, and Nick Rougeux came together and built one of the most usable, well-designed, and outright useful applications on top of any government data. (Another example of this, from some of the same crew, is the stunning Look at Cook budget site.)
But they did not stop there. As the result of a recent ethics ordinance the City released an RFP to create an online lobbyist registration system. The chicagolobbyists.org crew submitted a proposal. Clearly the process was eye-opening. Consider the scenario: a small group of nimble developers with deep subject matter expertise (from their work with the open data) go toe-to-toe with incumbents and enterprise application companies. The promise of expanding the ecosystem of qualified vendors, even changing the skills mix of respondents, is a new driver of the release of City data. (Note I am not part of the review team for this RFP.)
One of the earliest examples of civic startups — maybe the earliest — is homegrown. Adrian Holovaty’s Everyblock grew out of ChicagoCrime.org, which itself was a site built entirely on scraped data about Chicago public safety.
For more on the opportunity for civic startups see Nick Grossman’s excellent presentation. (And let’s not forget the way open data — and truly creative hacker-journalists — are changing the face of news media.)
Predictive Analytics
Of all the reasons for promoting a culture of data-driven decision-making, the promise of using deep analytics and machine learning to help us isolate patterns in enormous data sets is the most important. Open data as a philosophy is easily as much about releasing the floodgates internally in government as it is in availing data to the public. To this end we’re building out a geo-spatial platform to serve as the foundation of a neighborhood-level index of indicators. This large-scale initiative harnesses block- and community-level data for making informed predictions about potential neighborhood outcomes such as foreclosure, joblessness, crime, and blight. Wonkiness aside, the goal is to facilitate policy interventions in the areas of public safety, infrastructure utilization, service delivery, public health and transportation. This is our moonshot and 2012 is its year.
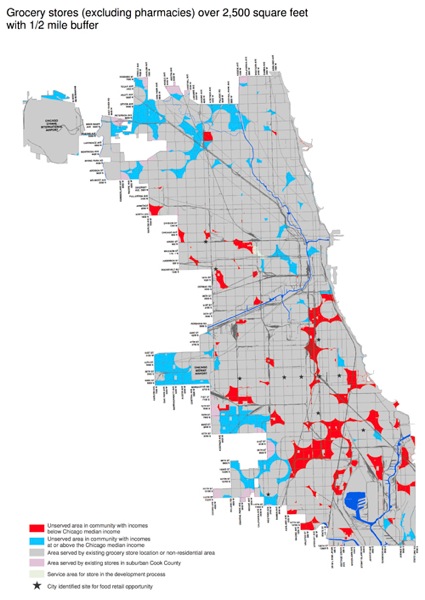
Above, a very granular map from early in the administration isolating food deserts in Chicago (click image for larger). It is being used to inform our efforts at encouraging new fresh food options in our communities. This, scaled way up, is the start of a comprehensive neighborhood predictive model.
Unified Information
The same platform that aggregates information geo-spatially for analytics by definition is a common warehouse for all City data tied to a location. It is, in short, a corollary to our emergency preparedness dashboards at the Office of Emergency Management and Communication (OEMC), a visual, cross-department portal into information for any geographic point or region. This has obvious implications for the day-to-day operations of the City (for instance, predicting and consolidating service requests on a given block from multiple departments).
But it also is meaningful for the public. Dan O’Neil recently wrote a great post on the former Noel State Bank Buiding at 1601. N. Milwaukee. It’s a deep dive into the history of a single place, using all kinds of City and non-City data. What’s most instructive about the post is the difficulty in aggregating all this information and the output of the effort itself: Dan has produced a comprehensive cross-section of a small part of the city. There’s no reason that the City cannot play an important role in unifying and standardizing its information geo-spatially so that a deep dive into a specific point or area is as easy as a Google search. The resource this would provide for urban planning, community organizing and journalism would be invaluable.
There’s more in store for 2012, of course. It’s been an exhilarating year. Thanks to everyone who volunteered time and energy to help us get this far. We’re only just getting started.
Municipal devices
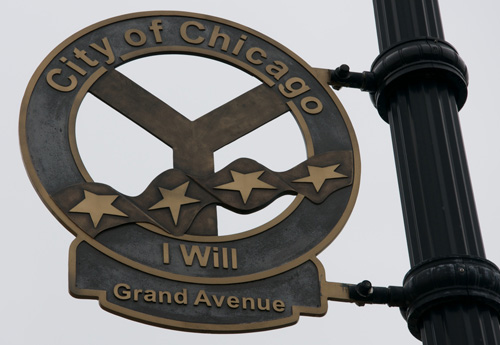
There’s a somewhat unknown symbol of Chicago called the “Municipal Device”. Basically a Y in a circle. It’s a representation of Wolf Point, where the main, north, and south branches of the Chicago river converge. It’s not nearly as ubiquitous as the Chicago flag or the city seal, but it’s actually all over the place if you look carefully. It’s embedded in building facades, attached to an occasional streetlamp, and the logo of the Chicago Public Library. (It’s even part of a light pouring through the girders of the Division Street Bridge.)
If you know me well enough you’ll understand that the very idea that Chicago has a municipal device that’s embedded in the built environment but seldom noticed is appealing on all kinds of levels.
Surely you see where I’m headed with this.
In the case of the symbol the word “device” is a throwback to heraldry. But what about the more typical definition, a functional device? What examples of this are specifically in the service of the municipality?
Let’s start at street level. The public way currently hosts plenty of digital, networked objects.
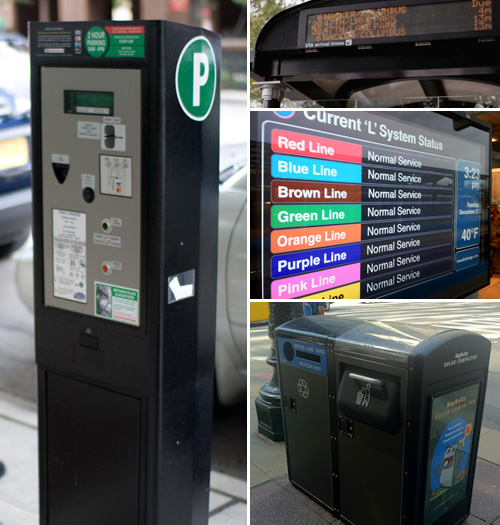
Photos: left by Flickr user Sterno74, upper right by Chicago Tribune
There are 4,500 networked (solar-powered) parking meters on city streets. The CTA is outfitting train platforms and bus shelters with digital signage with transit information. Even some of our public trash cans are networked objects.
Add to these public shared bike stations (coming soon), all the non-networked screens on the sides of buses and buildings, and infrastructure systems like traffic signal controls, snowfall sensors, streetscape irrigation, and video cameras.
Lastly — and most importantly — are the legions of networked people walking down any given street. Smartphones turn a sidewalk of pedestrians into a decentralized urban sensor network. (A topic for a future post.)
The point is, none of these municipal devices are interoperable, very few work from a common platform, and only a handful are actually open in the sense that a sidewalk is open and public.
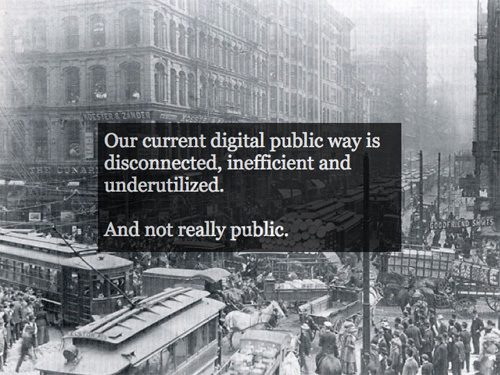
How the physical public way is actually used is a good model as we consider what a real digital public way comprised of these disarticulated “devices” might be like. The sidewalk, for instance, is a public space with fairly liberal parameters for usage. Beyond being a route for perambulation it’s a place for free speech and protest, vending, chalk artistry, flâneurism, kids’ lemonade stands, café seating, poetry distribution, busking, throwing bags, chance encounter, and all sorts of other things. Public space in general is the primary mode of information throughput in an urban area.
The question we’re asking ourselves at the city is, how would a digital public way that seeks this level of openness and breadth of use actually work? And what would city government need to do to ensure that the best foundation is laid for this to come to pass? (We’ve begun design and have a few early-stage pilots planned, but my hope with this post is that it begins the conversation broadly about what could and should be.)
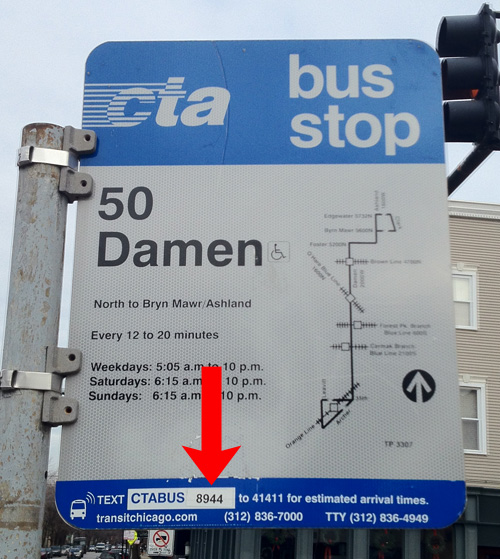
Here’s a very low-tech example of a networked public object. All bus stops in the city have signs with a unique SMS shortcode. Waiting riders can text this number for a list of upcoming buses and times. Conceptually this is a one-on-one networked interaction between a person and a public object, the sign. (Technically of course it involves a wide-area network, but we know that near-field communication is on the horizon, and coming to the CTA.)
One way to think about a digital public way is to ask what benefits would accrue to residents and visitors if all public objects were queryable like this. It makes sense for transit, possibly even with certain of the city’s service vehicles, but that seems a limited way of interacting with a municipal device: one-way and purely informational.
There are two other ways of thinking about an open digital public space, it seems to me, and they both have to do with thinking of the city as a platform for interaction.
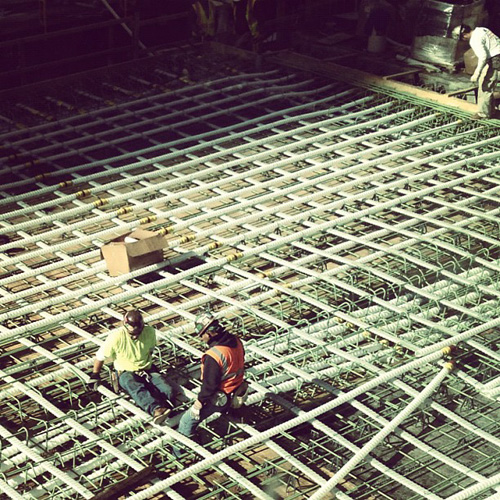
Photo by Jack Blanchard
The first is to recognize that interaction with all forms of government is increasingly happening online and/or via mobile devices. For instance, plenty of cities have mobile service request (e.g., pothole reporting) smartphone apps. If we think of the currently-installed devices listed above as merely end-points for a network connection to be built upon the city becomes a kind of physicalized network, a platform, for other uses. What might it mean to extend the currently-proprietary network connections for these devices for extremely local, public use? What might it mean for digital literacy in our communities if service requests could be made at the physical locations that they are needed? Thinking of these thousands of points of network tangency enables a scale of functionality that no website or mobile app ever could.
The second is also about platforms. Chicago’s open data portal hosts hundreds of regularly-updated, machine-readable data sets. These sets are the vital signs of the city: public safety, infrastructural, educational, business data, and on and on. They also represent a platform for creating new things. Developers can access the data directly via the portal’s API (application programming interface), building apps that provide new functionality and in some cases radically new uses of the data. (The Apps for Metro Chicago competition hosts a good gallery.)
Now conceive of the city itself as an open platform with an API. Physical objects generate data that can be combined, built upon, and openly shared just as it can be from the data portal. The difference in this scenario is location. Where much of the data in the portal is geo-tagged, data coming from the built environment would be geo-actionable. That is, in the city-as-platform scenario certain data is only useful in the context of the moment and the place it is accessed.
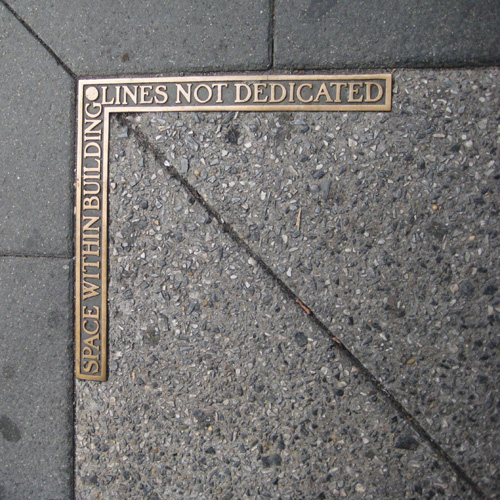
Photo by Jen Masengarb
Here’s a simple example.
The bus shelter you’re waiting at informs you (via personal device or mounted screen) that the public bike share rack at your intended destination is empty. It suggests taking a different bus only a minute behind the one you are waiting for in order to access a bike a few blocks from where you had intended. It offers to reserve the bike to ensure its availability and sends you a map of protected bike lanes (plotted to avoid traffic congestion around a street party) that you can use to reach your final destination.
What’s key about this is the diversity of data sources involved — real-time bike rack status (and reservation), bus locations, route info, protected bike lane locations, traffic volumes and incidents, and cultural event data — but also the fact that it would be nearly meaningless in any place but that exact shelter.
This scenario is the result of a network of interlinked municipal devices. But it needn’t be city government that creates such a scenario end-to-end. By exposing and documenting the data that makes the above possible (as we do with Bus Tracker and Train Tracker) we would enable developers to create their own ecosystem of applications. It’s a business model and the driver of the emergence of civic startups.
You could call such a set of open, networked objects the beginning of an urban operating system and certainly there’s another discussion entirely to be had around how what I’ve described forms the basis of a common operations platform for managing city resources internally. But I’m growing skeptical of calling all this an operating system, at least in the sense we traditionally do. Much of the talk of an urban OS focuses solely on centralized control. But if you’re true to the analogy of a computer operating system it would have to be a platform for others to build applications upon. In truth, this is a lot more like a robustly deployed, well-documented set of fault-tolerant API endpoints than it is an OS.
On the original Y-shaped municipal device there’s an odd slogan that sometimes accompanies it: I Will. It’s a quotation from a turn-of-the(-last)-century poem by Horace Fiske. If you can get past its priapismic opening and closing lines, you’ll find a pretty forgettable example of overly-gilt regionalist verse.
It’s curious. I will what? In the poem, Chicago, embodied as a goddess, seems to be saying that she will “reach her highest hope beyond compare”. Which doesn’t really say anything at all. What does she hope for?
What would you hope for in a city of networked municipal devices?
The kind of Innovation Chicago is
The economist Edward Glaeser has called Chicago “a city built upon corn in porcine form”. He’s referring to the city’s remarkable 19th century transmutation of the natural bounty of prairie agriculture into a higher value form of commerce, pigs. The innovation necessary for the cold storage and transportation of which would help Chicago become the central node in a nation-spanning rail network. It was the beginning of greatness.
We can effect this transformation again. Our natural bounty today is data, knowledge, and ideas — their “form” the establishment of new businesses and a more livable Chicago.
Today Chicago gets a new mayor and a new administration. I’m proud to be its Chief Technology Officer, a role I took for a single, simple reason. For the last three years I have traveled the world consulting with cities on strategies for making them smarter, more efficient, and more responsive to citizens. Many of these talks and projects were fruitful, but none of them mattered to me personally. None of them, in short, mattered to the city I love most.
The coming of the web, you may recall, was cause for all kinds of pronouncements that we’d move away from each other, tied only by network communications, happily introverted in electronic cocoons. This has not happened (indeed the reverse is happening). If anything the ubiquity of network technologies has proven that place matters. Mobile computing and “checking-in”-style apps are ascendant because we are creatures of place. And my place, the place of four generations of my family, is Chicago. It’s time to focus my effort here.
The transition report published last week is a roadmap for the change the Emanuel administration will undertake. All of the initiatives are exciting and important, but one speaks directly to remaking Chicago as a hub of information that leads to insight and growth.
Set high standards for open, participatory government to involve all Chicagoans
Why do this?
Without access to information, Chicagoans cannot effectively find services, build businesses, or understand how well City government is performing and hold it accountable for results.How will we do this?
The City will post on-line and in easy-to-use formats the information that Chicagoans need most. For example, complete budget documents – currently only retrievable as massive PDF documents – will be available in straightforward and searchable formats. The City’s web site will allow anyone to track and find information on lobbyists and what they are lobbying for as well as which government officials they have lobbied. The City will out-perform the requirements of the Freedom of Information Act and publicly report delays and denials in providing access to public records.The City will also place on-line information about permitting, zoning, and business licenses, including status of applications and requests. And Chicagoans will be asked to participate in Open311, an easy and transparent means for all residents to submit and monitor service requests, such as potholes and broken street lights. Chicagoans will be invited to develop their own “apps” to interpret and use City data in ways that most help the public.
Participatory government isn’t the only use of the wealth of information the city can publish. We intend data-driven decision-making, powered by deep analytics of our services and city vital signs, to be central to the day-to-day business of running Chicago.
A data-centric philosophy is more than transparency and efficiency, too. It is about fostering innovation. Business is built on local resources. Where once we transformed grain into pigs into commodities, we can now provide data that serves as a kind of raw material for new business and new markets.
(One example of this — and proof that the talent to do great things is right here, right now — is the design of a “smart intersection” by the students from George Aye’s Living In A Smart City class at the School of the Art Institute this semester.)
There’s plenty more in store for technology to assist in Chicago’s growth and livability. It’s suffused throughout the transition report: promoting entrepreneurship, increasing access to broadband, treating the street as a platform for interaction itself (more of which on all these in future posts). But the foundation is data. Access is an important first step, followed quickly by the tools and policies for taking action on it.
Chicago knows how to do all this. We’ve been doing it for over a century. We have the talent in the private sector, in academia, and in our non-profits to capitalize on any impetus city government can give. Let’s get going.
Looking into the past
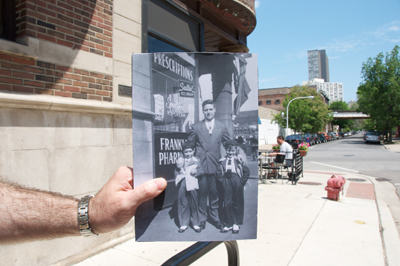
Left-to-right: my father, grandfather, and uncle
Dakin and Sheridan in Lakeview, Chicago. May 29, 2009, some fifty years after the inset photo was taken. (Larger versions available here.)
This location is a few houses down from where my father grew up. To the west (behind the photographer) Dakin dead-ends into the Hebrew Cemetary. Straight ahead is the CTA Red Line at the Sheridan stop. Three blocks to the south (right of the photographer) is Wrigley Field. A childhood paradise!
This particular corner has housed a pharmacy, a porn shop, a coffee house, and a taqueria, among other things.
There’s a lot more of this now-and-then style photography in the Looking into the Past Flickr pool.
Thanks to Chris Gansen for a fun midday diversion.
Straight from T. Herman Zweibel
While on the hunt for my family’s local history I was helpfully pointed to the online archive of the Chicago Tribune. It is an amazing resource and one hell of a timesuck. Half the time it feels like you’re reading the Onion; the other half makes you realize just how far newspapers have fallen as the organ of record for society.
I stumbled upon this bizarre blurb from Oct. 14, 1920, back when the Trib was known as the Chicago Daily Tribune (“The World’s Greatest Newspaper,” apparently). It reads like some kind of personal alternate universe.
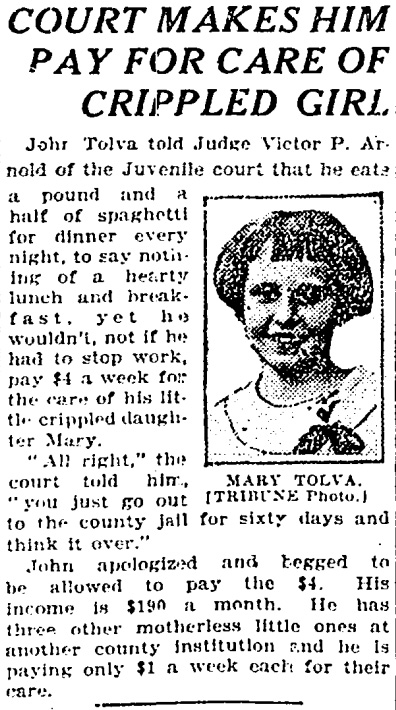
That John Tolva sure was an ass.
Note that I too have three children, though they are thankfully not motherless. Also, I do not eat a pound and a half of spaghetti each night.
1903
Departure
On the train to Naples the old ladies in black thought she was menstruating when she asked them for help disposing the bloody cloth. She let them think so. The train was cramped when they left Barile, but when it picked up passengers in Potenza it filled so full you merely leaned into others to maintain balance. It was not the place to make a public fuss over a choleric baby.
Living in a big, old city like Chicago is a four-dimensional experience. You move around the street grid, up high into skyscrapers, down into the underbelly of subway tubes, but time too is layered into the built things, seen only if you are looking, meshed into the streetscape like a discolored piece of gum that’s just another part of the sidewalk. Until you look more closely at it.
The baby hadn’t made a noise since they arrived at the port. He was swaddled up against Grazia tight enough that she’d feel it if his shallow breaths stopped. She sat down on the steamer trunk. Giuseppe, unsure which ship was theirs, barreled chest-first into the noisy confusion of Neapolitan seamen, stevedores, travelers, and common thieves. Grazia attempted to nurse, but she couldn’t let down. The baby had not taken milk in eight days.
I knew that my great-grandparents had come to live in Chicago in the same way I know Mrs. O’Leary and Al Capone and Saul Bellow lived here — and with about as much tangible connection to same. Certainly I had occasion to think of their lives. Three times in 14 years I had trekked to their village in poor, arid southern Italy, learning a bit more each time, eventually being welcomed by their hometown as one of their own. And that was part of the problem. I could connect with them in Italy, but not here, in the town where they started a new life and became American.
Gibraltar was still in sight when baby Michele died. There were no facilities to keep his body on board. An Arbëreshë steward who heard his own strange accent echoed in the parents’ sobbing drew Giuseppe close, felt the bitter waft of Amaro Lucano on the big man’s breath, and told him that he could not emigrate with a corpse. Michele, tightly bound and ballasted, was lowered gently into the waves. Grazia heaved somewhere in a mass of ladies in black and rosaries. Giuseppe changed some of his dollars for lire and drank it away.
I had gone searching before, just before the last trip to Italy. I started at the end, hunting with my kids for a nondescript tomb marker. We found Giuseppe, buried Joseph Tolva, on a sweltering summer day that gave way to a torrential storm just as we found the house he lived in when he registered for World War I in 1915. But these were milestones only. Markers of events, not the experience of a life. I had the records from Italy, the scraps of US government documents from the period, even a few photographs, but what most eluded me was Giuseppe’s connection to my city.
They had argued about taking the baby to America as sick as he was, but the passage was paid, the job was arranged, and the padrone was waiting in Chicago. There would not be a second chance. On July 28, 1903, nine days after they lost the only thing of importance they brought from Italy, Giuseppe and Grazie Tolve arrived in New York City. Three lines, one of them crossed out, on the ship manifest marked their entry. Giuseppe admitted to carrying $25 and told the agent they were bound for one Rocco Calandriello Jr. at 50 Blue Island Ave., Chicago.
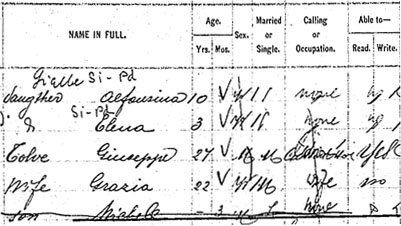
Arrival
That name and that address have perplexed me for years. None of my living relatives had heard of Rocco Calandriello, Ancestry.com had too many records to be useful, and 50 Blue Island Ave wasn’t an address that existed anymore. I considered it a dead end.
A few weeks ago at a conference I met Dennis McClendon, a professional mapmaker from Chicago. I casually mentioned that I knew that streets had been renumbered earlier last century but that I had gotten no further. Dennis cleared up my confusion in the span of about 15 minutes. On his laptop he brought up a scan of the 1909 document detailing all the renumbered buildings. Six years after Giuseppe and Grazia arrived 50 became 707 Blue Island Ave.
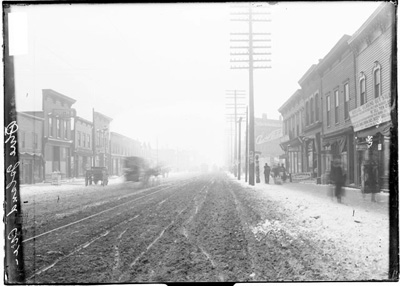
Blue Island Avenue covered in snow, with stores on either side, pedestrians on the sidewalk and horse drawn vehicles in the street, 1907. Source: Chicago Historical Society
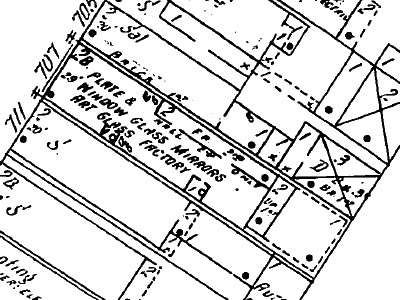
Source: Sanborn Fire Insurance Maps of Chicago
Of course, the building could have been something vastly different in 1903, though it is marked as a business rather than a residence from as early as 1886. My guess is that Rocco Calandriello really was Giuseppe’s uncle, though an uncle through marriage, but what he did and why he did it at 50 Blue Island Ave. is not something the documents tell us.
Before I could inform Dennis that Google Maps still couldn’t locate 707 Blue Island Ave. he noted that part of that street had been demolished in the 60’s to make space for the University of Illinois at Chicago campus — the very campus the conference we were attending was being held on!
We overlaid the pre-destruction map on current satellite photography of the area and had a lock. I was out the door with my camera before I could even say thanks.
Blue Island Avenue is one of a handful of diagonal streets in Chicago, cutting southwest to northeast into the city center. Before the university was built it ended at Harrison Street; now it stops at Roosevelt Rd. Interestingly — and helpfully — the campus layout largely preserves the outline of the original thoroughfare. The gum you notice on the sidewalk only when you step in it.
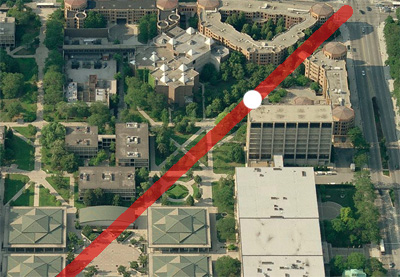
I’m pretty sure this is where 50 Blue Island Avenue once stood. Coincidentally, this spot is a few hundred feet from where Jane Addams’ Hull House now resides, having been moved from its original location during the UIC construction. Given that recently-arrived Italians constituted a major slice of the neighborhood that Hull House served it is almost impossible to think that Giuseppe and Grazia did not receive assistance from Addams.

I didn’t find Rocco and of course the building is gone, but I tramped around the Near West Side on a few Saturdays and came to know the area of town my great-grandparents called home. It grounded something for me, fleshed out another dimension of my personal relationship to the urban space. And set the stage for 1909.
Oh Argh Dee!
Last weekend was ORD Camp, a Foo Camp-style “unconference” of creative nerds in and around and friends of Chicago.
You know how you can get lost in Wikipedia just jumping from one non sequitir article to the next? Yeah, it was like that. And it was 100% stimulating.

I had a one-on-one demo of how an industrial grade toilet flush works (think toilets in public buildings ). This came complete with a partially exposed flusher demo and an engineer who was totally passionate about his craft. And they all have such wonderful names. What I learned: if you want to destroy a building with these types of valves just evacuate all the air in the place. The valves work off of air pressure and without that the full force of the city water mains will come rushing in.
I heard from a fellow who had essentially reverse-engineered the Chicago Transit Authority bustracker data to create his own unofficial API. What I learned: There is GPS error introduced when buses hit the satellite-blocking skyscrapers downtown. Of course, hacking the CTA means you can do your own thing and adjust for the error. Pure awesome.
I met Rania El-Sorrogy, a recent De Paul grad, who has made a name from herself by designing a modular bookbinding system simply because she was so irritated at having to lug huge textbooks on her commute to class. Basically her system is an interlocking spine that lets you slide in and out sections of a book based on what you want to ready or carry. An example of the malleability of e-text infecting the tried-and-true form of the codex. What I learned: I was not a fraction as entrepreneurial or award-winning as Rania when I was in college.
I learned the basics of building a compiler for the ultra-high availability programming language called Erlang. Because, you know, that’ll come in handy at some point. What I learned: Some people like to do things (like, say, write web apps in a language completely hostile to doing so) precisely because they are insanely difficult.
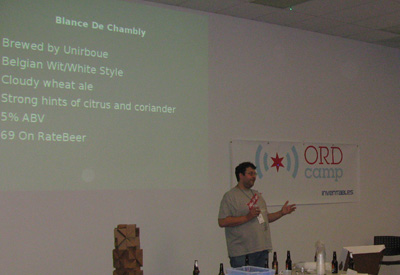
I heard Moshe Tamssot, a brilliant dude at Kraft talk about how he has made a career of infiltrating hugh companies and fostering an entrepreneurial creativity inside of them. Handy, especially when you’re moderating a panel on said topic at SXSW in a few weeks. What I learned: The best way to look like you know what you are talking about is to invite people who know what they are talking about to be on your panel.
I participated in a thought exercise about how we’d save America if we were the newly appointed federal CTO and we had $100 billion at our disposal. Basically we settled on overhauling the energy grid (for efficiency), our education system (specifically the ability of it to be nimble and responsive to a world that changes faster than institutionalized knowledge), and broadband (specifically getting it to everyone, stat). Sound familiar? What I learned: there’s a great deal that makes sense in acknowledging that outsourcing and the globalization mantra of seeking the lowest-cost source for your product or service is a futile race to the bottom. Eventually you’ll hit bottom: there’ll be no new countries whose underpaid workforce you can exploit. The solution: forget about people, go straight to the robots. The vision: thousands of 3D printers, miniature fab factories, and robots spread out in communities around the country that can make anything locally. Import and export reverts to raw materials only. A not altogether infeasible or undesirable future. (Did I just blow your mind?)
I met a professional cartographer at lunch. And that would have been cool enough, for I do not know any professional cartographers. But, as this was ORD Camp, his speciality was Chicago mapmaking. He was a walking atlas and our short discussion sent me out into the cold on foot on an adventure into my family’s past. (But that, friends, is for a dedicated post.) What I learned: Even cartographers get lost.
A great, stimulating weekend. Many thanks to Google and Inventables for orchestrating it all. Can’t wait for next year.
Crowds in Grant Park
People demanding change, a museum fixed in time.
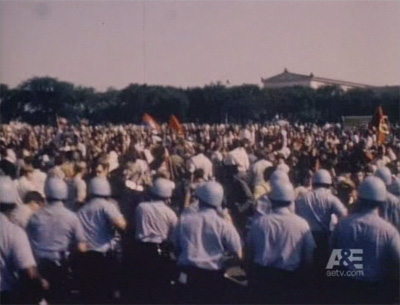
Protesters at the 1968 Democratic National Convention
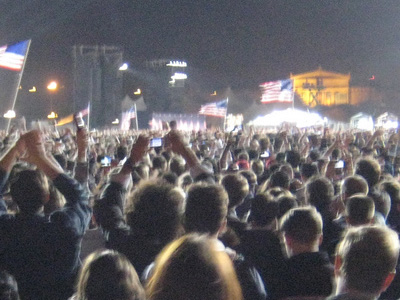
Supporters on election night, 2008
Throwback
I’m headed to Wrigley this afternoon to catch the Cubs in their current hot streak. It’s going to be a unique game. Apparently today the club will celebrate 60 years of being televised by WGN by trying to emulate a game from 1948.
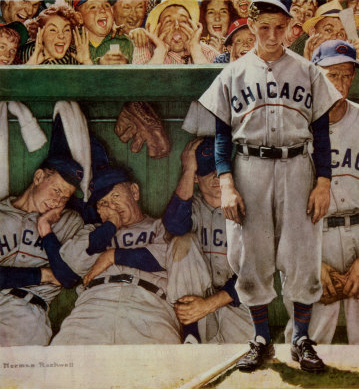
Norman Rockwell, The Dugout
There have been retro days before, but this one is fairly unique. In addition to the 1948 uniforms (which for the opposing Braves is a Boston uniform) the telecast will be in black-and-white for the first few innings. Camera angles will be limited and the center field camera (which provides the batter close-ups) will be offline. Certain vendors will be offering 1940’s-era victuals at 1940’s-era prices. How cool is that? More info here.
Fans are encouraged to dress the part too, but I’ll be damned if I am going to put on a suit and fedora. Well, maybe just the fedora. How does one dress for 1948?

